Unhypnotized
Truth feeder
Steven Goddard
Watts Up With That?
March 9, 2010
Last month we discussed how NASA continues to spread worries about the Antarctic warming and melting.
A January 12, 2010 Earth Observatory article warns that Antarctica

NASA’s 1982-2007 map showing Antarctica warming
http://earthobservatory.nasa.gov/Features/WilkinsIceSheet/images/wilkins_avh_2007.jpg
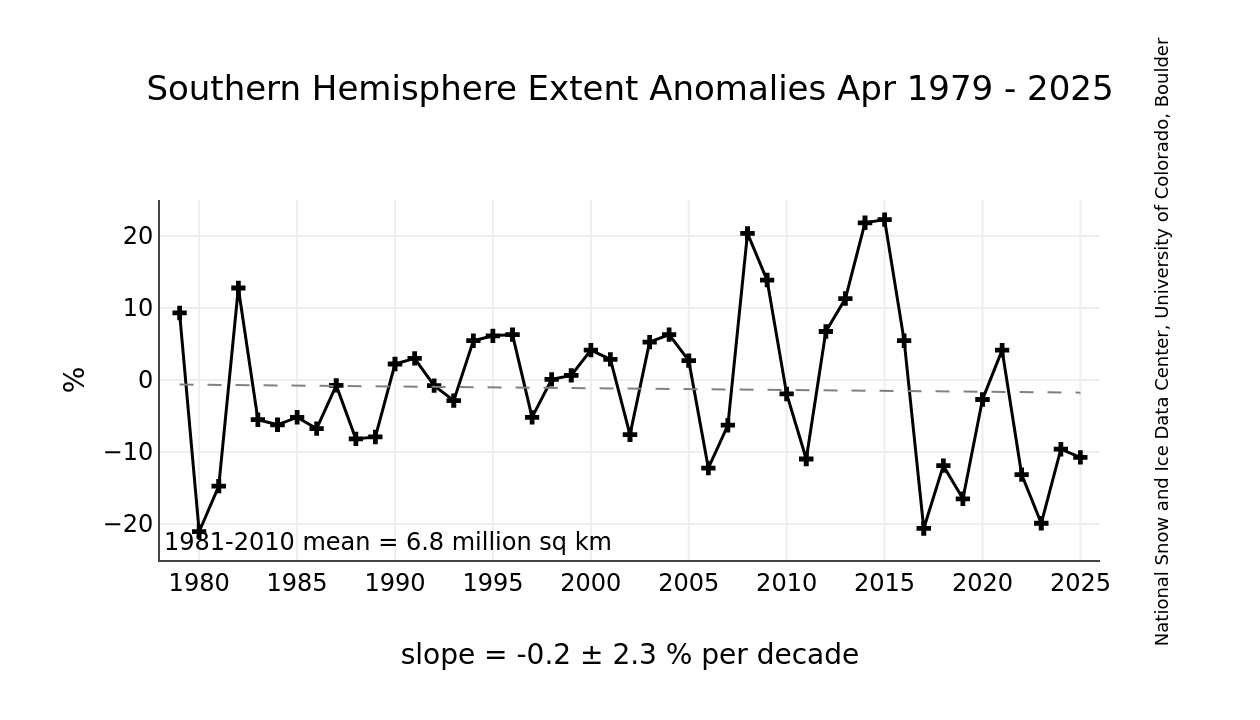
But NSIDC seems to be thinking differently in their March 3, 2010 newsletter. *They say Antarctica is cooling and sea ice is increasing (makes sense – ice is associated with cold.) **

http://nsidc.org/data/seaice_index/images/s_plot_hires.png
http://nsidc.org/data/seaice_index/images/s_plot_hires.png
UAH satellite data also shows Antarctica cooling, as seen in their map below. *(This map is dated November, 2006 – if anyone knows where to get a more recent version, please let me know.)

http://climate.uah.edu/25yearbig.jpg
UAH 25 Year Temperature Trends
Perhaps NASA should have stuck with their original 2004 map below, showing Antarctica’s interior cooling?

NASA’s 1982-2004 map showing Antarctica cooling
While there’s no dispute that there’s some sea ice loss in the Antarctic peninsula, all signs seem to point in the opposite direction of what some what have you believe about Antarctica as a continent.
Source...
Watts Up With That?
March 9, 2010
Last month we discussed how NASA continues to spread worries about the Antarctic warming and melting.
A January 12, 2010 Earth Observatory article warns that Antarctica
“has been losing more than a hundred cubic kilometers (24 cubic miles) of ice each year since 2002” and that “if all of this ice melted, it would raise global sea level by about 60 meter (197 feet).“
[Note that is continental ice, not sea ice, - Anthony]

NASA’s 1982-2007 map showing Antarctica warming
http://earthobservatory.nasa.gov/Features/WilkinsIceSheet/images/wilkins_avh_2007.jpg
But NSIDC seems to be thinking differently in their March 3, 2010 newsletter. *They say Antarctica is cooling and sea ice is increasing (makes sense – ice is associated with cold.) **
Sea ice extent in the Antarctic has been unusually high in recent years, both in summer and winter. Overall, the Antarctic is showing small positive trends in total extent. For example, the trend in February extent is now +3.1% per decade. However, the Amundsen and Bellingshausen Seas show a strong negative trend in extent. These overall positive trends may seem counterintuitive in light of what is happening in the Arctic. Our Frequently Asked Questions section briefly explains the general differences between the two polar environments. A recent report (Turner, et. al., 2009) suggests that the ozone hole has resulted in changes in atmospheric circulation leading to cooling and increasing sea ice extents over much of the Antarctic region.
The NSIDC graph below shows the upwards trend in Antarctic Sea Ice. *Some recent years have shown anomalies as high as +30%.

http://nsidc.org/data/seaice_index/images/s_plot_hires.png
http://nsidc.org/data/seaice_index/images/s_plot_hires.png
UAH satellite data also shows Antarctica cooling, as seen in their map below. *(This map is dated November, 2006 – if anyone knows where to get a more recent version, please let me know.)

http://climate.uah.edu/25yearbig.jpg
UAH 25 Year Temperature Trends
Perhaps NASA should have stuck with their original 2004 map below, showing Antarctica’s interior cooling?

NASA’s 1982-2004 map showing Antarctica cooling
While there’s no dispute that there’s some sea ice loss in the Antarctic peninsula, all signs seem to point in the opposite direction of what some what have you believe about Antarctica as a continent.
Source...
